 SAN FRANCISCO, CA - The confidence with which Bay Area homebuyers roared into 2018 waned notably by the end of the year, leading to the largest 2018 year-over-year decline in sales activity in December, down by 22 percent. Though all regions posted similar drops in activity, the Wine Country led the cooling, while San Francisco fared slightly better than other regions. Also, fewer sales were seen across all price ranges in all Bay Area counties (this analysis excludes Solano County).
Despite the winter drop in sales, total activity in 2018 showed a slight improvement over 2017, with a 1 percent increase across the Bay Area. Santa Clara and Sonoma counties, however, did conclude the year with sales declines, while San Francisco outpaced the previous year with a 9 percent increase in activity. Also, annual declines continued to be driven by fewer sales below $1 million, while higher-priced sales, despite the winter slowdown, trended solidly above 2017. Sonoma and Santa Clara counties, despite posting overall sales declines from 2017, still showed more sales of homes above $1 million in 2018. Figure 1 summarizes year-over-year changes in the number of homes sold in 2018 compared with 2017 and across price ranges. The last column indicates year-over-year changes in December.
Figure 1:2018 versus 2017 overall changes in slaes of homes and by price range, as well as December year-over-year total change in sales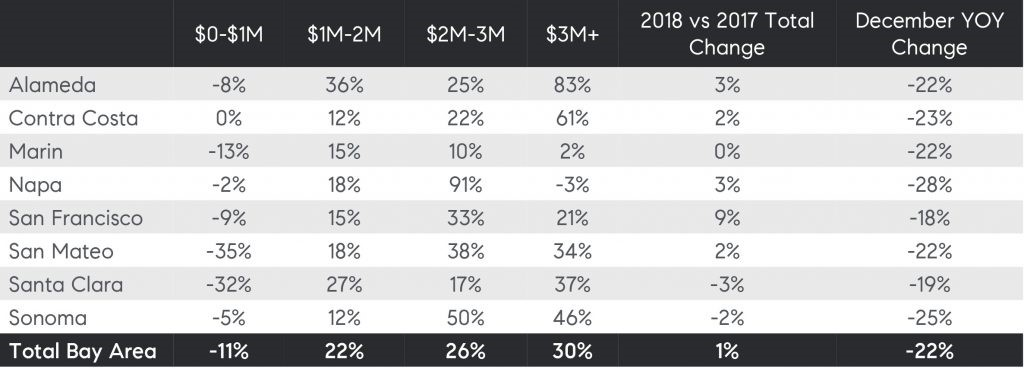
Source: Terradatum, Inc. from data provided by local MLSes, Jan. 7, 2019
At the same time, a 16-month trend of falling year-over-year inventory that began in the spring of 2017 finally reversed course in the summer of 2018, when most regions started to see an increase in supply from the year before. In December, there was more inventory across the region, mostly for homes priced at less than $2 million. Figure 2 illustrates changes in December year-over-year inventory by Bay Area county and price ranges. As noted in previous months’ analyses, Santa Clara County outpaced all other Bay Area counties, with almost twice as large of an increase than recorded anywhere else in the region. However, as November’s analysis demonstrated, the supply increase in Santa Clara County largely occurred in the southern part. While San Francisco saw some increase in inventory in the last months of 2018, the county posted another year-over-year decline in December, with fewer homes in all price ranges but those between $2 million and $3 million — a trend also observed in previous months. Higher-priced homes, those above $3 million, were slightly more available in some regions, particularly in the Wine Country, but across the overall Bay Area, such inventory was unchanged from last December.
Figure 2: December year-over-year change in inventory by Bay Area county and price range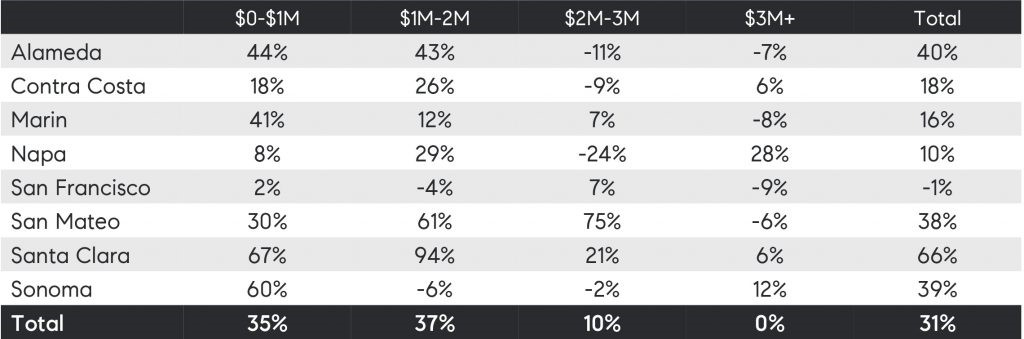 Source: Terradatum, Inc. from data provided by local MLSes, Jan. 7, 2019
When examining inventory gains, it’s important to keep in mind that the increases come on the heels of very low levels of homes for sale. Thus, even with more homes for sale, inventory in Santa Clara County reached only a 1.7-month supply in December from 0.7 months’ last year, which is notably below the six-month supply mark considered to be a balanced benchmark between buyers and sellers. The months’ supply of inventory estimates the amount of time it would take for buyers to absorb the listings currently for sale.
Figure 3 illustrates the months’ supply of inventory in December compared with last year by Bay Area county. Importantly, no region reached the six-month benchmark, not even Napa County, where supply increased to 4.6 months. Again, San Francisco saw a lower months’ supply of inventory compared with last December. Thus, while housing-market dynamics shifted at the end of 2018, the balance between potential demand and the availability of homes for sale is only slowly normalizing.
Figure 3: Months’ supply of inventory by Bay Area county, December 2017 versus December 2018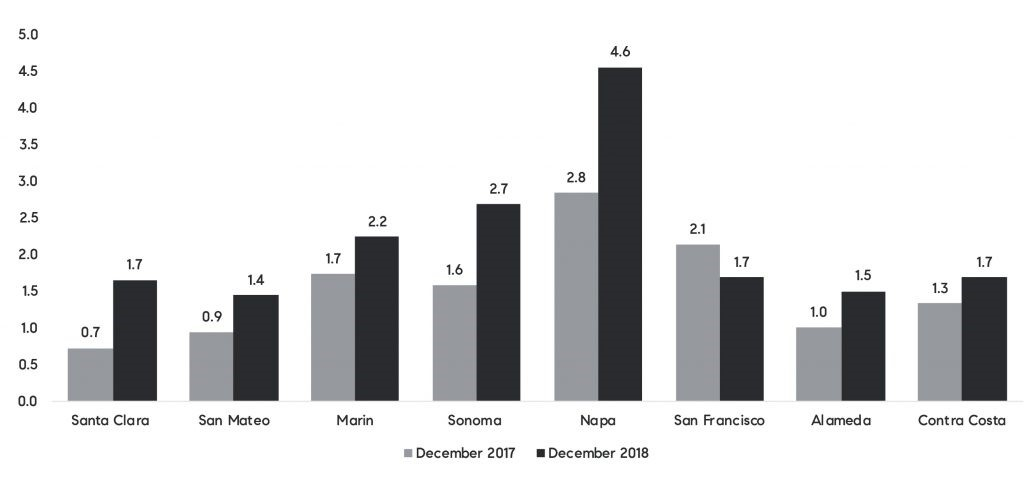
Source: Terradatum, Inc. from data provided by local MLSes, Jan. 7, 2019
Furthermore, buyers’ retreat at the end of 2018 — driven by multiple uncertainties including political issues, financial volatility, and concerns over the future of economic growth — fostered a better balance between buyers and sellers than seen at the beginning of 2018. Buyers were more cautious, taking longer to shop around and making fewer offers. In December, Bay Area homes generally sold in four weeks, which is two weeks longer than seen at the same time last year. Also, fewer homes sold for more than asking price, with four in 10 fetching premiums, down from six in 10 at the same time in 2017.
Figure 4 illustrates the changes in buyer and seller dynamics via several key market indicators: average days on market, share of homes selling for more than asking price, and the average premium for homes that sold above asking price. As noted above, compared with last year, homes took two weeks longer to sell, with the largest increase in days on market in Sonoma County at 55 days, up from 35 days in December 2017. The decline in the share of homes that sold for more than asking price had the largest impact in Santa Clara County, where the share declined by 38 percentage points, from 79 percent last year to 41 percent at the end of 2018. Lastly, the premium received for homes that sold for more than asking price also dropped by 3 percentage points, from an average of 10 percent to 7 percent, with the decline driven by a 9 percent decrease in Santa Clara County. San Francisco sellers continued to receive the highest premiums in the Bay Area, averaging 13 percent more than asking price — 1.4 percentage points below the 14.4 percent obtained last December.
Figure 4 : Major December 2018 housing-market metrics by Bay Area county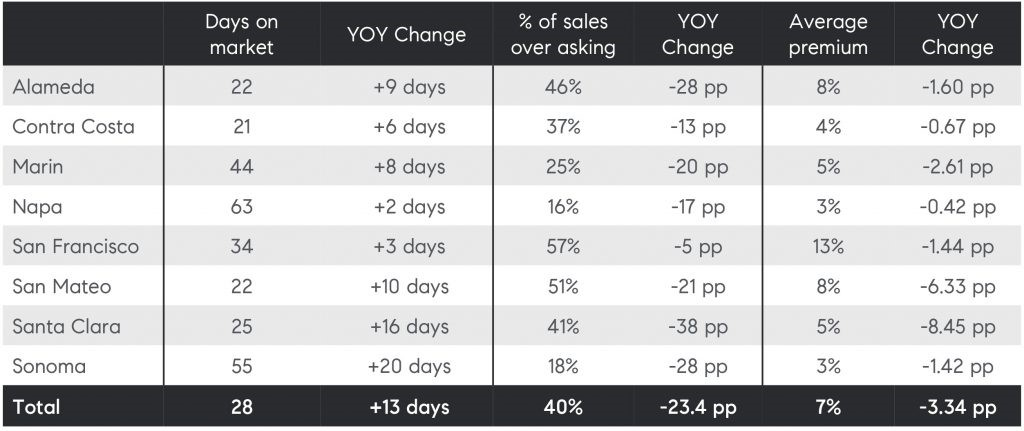
Source: Terradatum, Inc. from data provided by local MLSes, Jan. 7, 2019
However, to bring buyers to the table, sellers adjusted their expectations, and many reduced their asking prices. Figure 5 illustrates the share of homes that sold with a price reduction by Bay Area county in December 2017 and December 2018. Across the Bay Area, the share of price reductions doubled, increasing from 15 percent to 33 percent of homes selling with a price reduction. Again, Santa Clara and Sonoma counties both saw a large jump in the number of reductions, with the latter nearing almost half of homes selling with price cuts.
Figure 5: Share of homes sold with price reductions by Bay Area county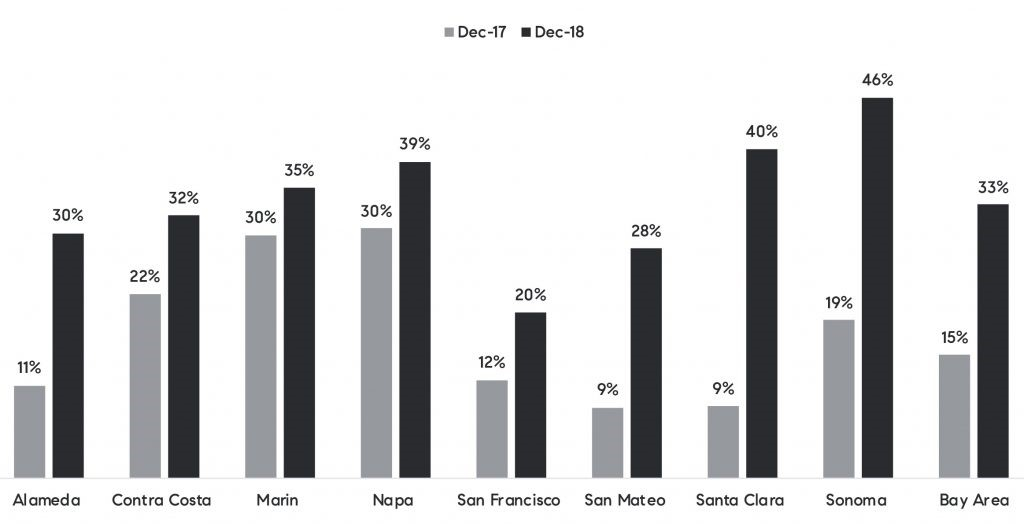
Source: Terradatum, Inc. from data provided by local MLSes, Jan. 7, 2019
Lastly, with increased buyer hesitance and more inventory, pressure on home price growth slowed considerably during the winter. In areas where 2018 started off with robust price growth, the year-end slowing of appreciation was most notable again in Santa Clara and Sonoma counties.
Figure 6 summarizes December median home prices by Bay Area county, along with the percent change from December 2017. The last column denotes overall price increase in 2018 compared with the year before. Thus, even with slowing price growth at the end of 2018, the year’s early gains ensured that home prices were still solidly above 2017 levels — more specifically, 12 percent across the Bay Area. Even with the recent cooling in appreciation, Santa Clara County still posted a 20 percent increase in its median home price in 2018. Napa and Sonoma counties fell on the lower end of the price-growth spectrum but still registered respective 6 percent and 7 percent gains.
Figure 6: Median home price changes by Bay Area county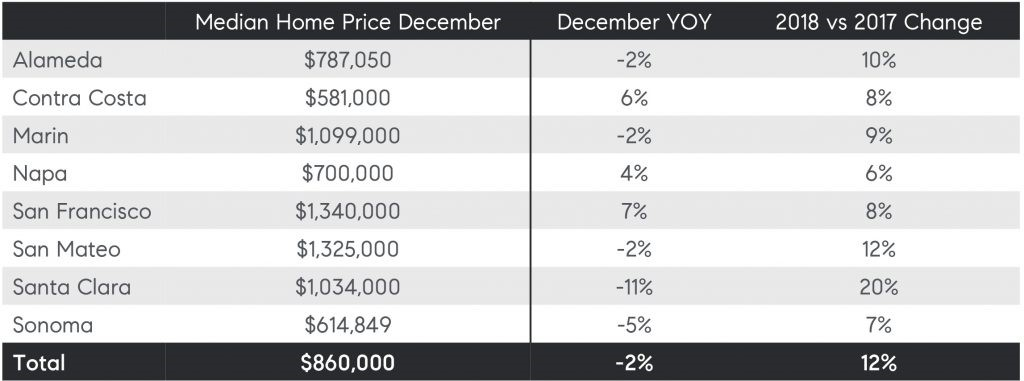 Source: Terradatum, Inc. from data provided by local MLSes, Jan. 7, 2019
In conclusion, housing activity in the Bay Area ended 2018 with less enthusiasm than it began the year. There were overall fewer total sales in 2018, though it’s important to keep in mind that inventory shortages and further year-over-year declines were persistent throughout the greater part of the year, thus holding back a drove of buyers. Also, the significant price growth that dominated the early part of year was not sustainable for much longer and to a large degree dissuaded many prospective buyers.
The rebalancing of seller and buyer expectations was inevitable. However, what may come as a surprise is the reason for the rate of inventory increases. The reasons for more inventory are many, not the least of which is the perception that Bay Area home price growth peaked in 2018, as well as the impact of the current legislation’s tax changes and the overall high cost of living in many local communities. Nevertheless, normalizing trends should be a welcome development for housing markets, as they create an improved balance between buyers and sellers. Also, with recent declines in mortgage rates and anticipation by the Federal Reserve and its observers to see fewer rate hikes in 2019, Bay Area homebuyers are looking at a relatively more favorable situation in 2019 than they were coming into 2018.
Still, uncertainties remain, as does the question of the prolonged government shutdown and its impact on housing markets and the overall economy. In California, 245,400 people work for the federal government, representing 1.4 percent of those who are employed. And while that is a smaller share than in some other parts of the country, it is still an important part of the economy and represents a significant number of prospective Golden State homebuyers.
About Compass
Compass is a real estate technology company with a powerful end-to-end platform that supports the entire buying and selling workflow. We deliver an incomparable experience to both agents and their clients all in service of the Compass mission: to help everyone find their place in the world. Founded in 2012 by Ori Allon and Robert Reffkin, Compass operates in cities across the United States including: New York, Los Angeles, Chicago, San Francisco, Seattle, Philadelphia, San Diego, Washington, D.C., Dallas, Austin, Houston, Nashville, Atlanta, Boston, Miami, Aspen, Orange County, Westchester, Santa Barbara, Montecito, Marin, Greenwich, Naples, Tahoe, Telluride and The Hamptons. Learn more and find your place at compass.com/careers and agents.compass.com.