
By Tim Estin mba, gri Broker Associate with Coldwell Banker Mason Morse
Executive Summary
Click here for the full report:
http://www.estinaspen.com/files/071612_1H%202012%20Estin%20Quarterly%20v18.pdf
The warm winter conditions in many parts of the country, a lack of snow over the winter/spring 2012 in the Aspen area, a sputtering national economy and captivating headlines coming out of Europe were factors contributing to the slowdown in Aspen real estate sales in the 2nd Quarter and 1st Half of 2012.
2nd Quarter 2012 Overall
In the 2nd Quarter 2012 (April through June), dollar sales volume was off -22% and unit sales were up +3% from 2Q 2011 for the combined Aspen and Snowmass Village real estate marketplace for single family homes, condos and vacant land sales excluding fractionals.
2Q 2102 Prices versus 2Q 2011
2Q 2012 Aspen Homes - Median Sold Price: $4.6M now vs $5.6M then, -18% - Average Sold Price: $5.4M now vs $6.6M then, -18% - Average Price/Sq Ft: $1,070 sqft now vs $1,039 then, +3% 2Q 2012 Aspen Condos - Median Sold Price: $995,000 now vs $1.4M then, -29% - Average Sold Price: $1.3M now vs $2.1M then, -38% - Average Price/Sq Ft: $923 sqft now vs $$1,070 then, -14%
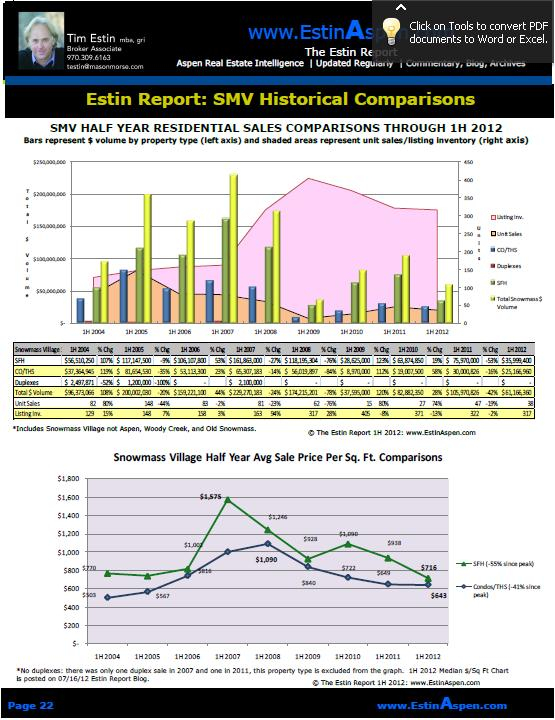
2Q 2012 Snowmass Village Homes - Median Sold Price: $2.8M now vs $5.2M then, - 46% - Average Sold Price: $3.4M now vs $6.8M then, -50% - Average Price/Sq Ft: $734 sqft now vs $1,207 then, -39% 2Q 2012 Snowmass Condos - Median Sold Prices: $661,000 now vs $835,000 then, -21% - Average Sold Price: $819,000 now vs $1.06M then, -23% - Average Price/Sq Ft: $623 sqft now vs $706 then, -12%
1st Half 2012 Overall
In the 1st Half 2012, the total Aspen and Snowmass combined dollar sales volume was off -25%, unit sales were off -7% and inventory of properties for sale decreased -7% compared to the same period last year. (See report pgs 6-7 for 1H 2012 Prices) More specifically, the lack of ultra-high end sales in the $10M+ range that had contributed so positively to a strong first half in 2011, in addition to continued pressure on pricing through the first half 2012, resulted in significant lower overall dollar sales compared to the same period last year. Over $10M Aspen and SMV Home Sales Comparison
o 1H 2012: sales over $10M = 5 sales, $66M or 16% of total dollar sales of $421M. This is - 67% less in unit sales and - 71% less in dollar sales over 1H 2011.
o 1H 2011: sales over $10M =15 sales, $226M or 40% of total dollar sales of $562M.
Last year at this time, a case was made that the “smart money”, big money that is, was getting in while the deals were hot, and it was only a matter of time before the rest of the market followed. At that time, certain currencies were trading very favorably to the dollar precipitating some deals by foreigners, while a depleting and limited inventory of large sized developer spec homes carried over from the market boom days motivated others into purchases at 30% -50% discounts to original prices.
Now, most of those newer ultra high-end spec homes are sold, there’s greater uncertainty in currency and global markets, and overall slowing economic trends combined with pre-election paralysis dominates the mood locally and elsewhere. But there is also a sense by many that if one doesn’t get into the market now one will have missed quite possibly the best Aspen real estate opportunity of a decade.
Compared to the mid-2000's boom era, 1H 2012 Aspen market activity, representing 85% of the total Aspen Snowmass combined market, is most similar in dollar sales to 1H 2004 levels but there are far fewer unit sales now than then, even though there is twice the inventory of properties for sale now (Multiple Listing Service (MLS) records do not go back further):
o Dollar volume in 1H 2012 was $302M versus $307M in 1H 2004.
o Unit sales in 1H 2012 were -42% less than 1H 2004, 94 units sold versus 163.
o Inventory levels were 56% more in 1H 2011 than 1H 2004, at 566 properties for sale now versus 363 then.
Many believe we bottomed 6-12 months ago, others feel we are still scraping the bottom but there is a consensus that the market has stabilized somewhere here – at or near a bottom. Whereas cautious optimism prevailed at the beginning of this year, there seems to be greater uncertainty at the half year mark.
In general, Aspen Snowmass prices have reset to a post-crisis level, off an average 30%-40% from the 2008 market peak and in a number of cases more, in a small number less. Much depends on the property, special circumstances and seller motivation. Except for extraordinary, one-of-a-kind properties, prices remain under pressure, at least incrementally, even assuming they have been adjusted to the new norm. But then, as read recently in a stock analyst’s report, “The new norm is increasingly the lack of a norm. Patterns of the past can no longer be relied on for guidance.”
Specific Trends
Land Sales Surging - As evidence of the growing appeal of the buy/build option, there has been the dramatic spike in vacant lot unit sales in June 2012 over June 2011, on top of gangbusters land sales for all of 2012 YTD. In June 2012 alone, there were (5) lot sales versus none (0) in June 2011; in 1H 2012, there were (20) vacant lot sales versus (9) in the same period last year, +122%.
The dollar volume for land sales has also surged +278%: in 1H 2012, land sales totaled $57M versus $15M during same time last year. And if one counts the sale of older 'teardown' homes as land sales in the first half of 2012, the difference in vacant lot sales this year to date over all of last year is even more pronounced, over +200%. Typically, when land sales start to pick up, it is an important marker of a market transition, a tipping point.
Lack of new product – As mentioned earlier, most of the newer developer built spec homes of 2006-2011 vintage have been sold at greatly discounted prices. A handful still exist, and for various reasons, B and C level locations in particular, these have yet to sell. But the must sell Aspen spec homes have largely been flushed out. There’s a vacuum, a lack of new-built product which makes some buyers unhappy and frustrated but creates opportunities for others.
On pricing - It would be a mistake to believe that prices have begun to rise except in highly unique and very special situations. Unfortunately, these atypical high priced sales drive the average price per square foot upwards and capture the media’s attention, but they do not represent the market at large where pricing pressure in general continues, even if incrementally (see Aspen and SMV Sold Avg Price/Sq Ft Chart at bottom Pgs 15 and 22 and see Median Sold Price/Sq Ft Chart posted on Estin Report blog on 07/16/12).
Bottom line
While the environment remains challenging and 1H 2012 has underperformed hopes from the beginning of the year, overall market progress is being made. Given the pervasive negativity of daily macro-headlines, it is impressive that the Aspen market has not done worse. Since the market low in 1st Half 2009, Aspen and Snowmass combined total dollar sales are up +61%, unit sales are up +81% and the inventory of properties for sale has decreased -32%. All are evidence of a market gradually improving. With the exception of pricing, the 1H 2012 is the 2nd best half year mark since the recovery began.
In general, more is selling but at lower prices. Buyers are continuing to step up recognizing that now may offer an unprecedented opportunity to buy into the Aspen lifestyle at price points not witnessed in nearly a decade.
As Warren Buffett has so presciently said, “Be fearful when others are greedy. Be greedy when others are fearful."
Tim Estin mba, gri | The Estin Report | Top 1% Aspen Broker | Native Aspenite 970.309.6163 cell | 970.920.7387 office | 970-925-7027 fax Coldwell Banker Mason Morse Real Estate | 514 East Hyman Avenue | Aspen, CO 81611