 By Tim Estin with Mason Morse Real Estate
Report Description This Aspen Snowmass real estate report documents sales activity for 1st, 2nd and 3rd Quarters 2011 (Q1-Q3 2011, Jan 1 - Sept 30, 11) for the upper Roaring Fork Valley - Aspen, Snowmass Village, Woody Creek and Old Snowmass. Included property types are single family homes, condos, townhomes, duplexes and residential vacant land at sold at prices over $250,000. Fractionals are not included. The report compares the Q1-Q3 2011 to the Q1-Q3 of 2010, historical Q1-Q3 comparisons since 2004 and prior quarter and prior year quarter comparisons. There are three sections: Aspen/ Snowmass total market, Aspen market (includes Woody Creek and Old Snowmass) and Snowmass market. The source data is the Aspen/Glenwood MLS.
 Click image for full report.
Executive Summary
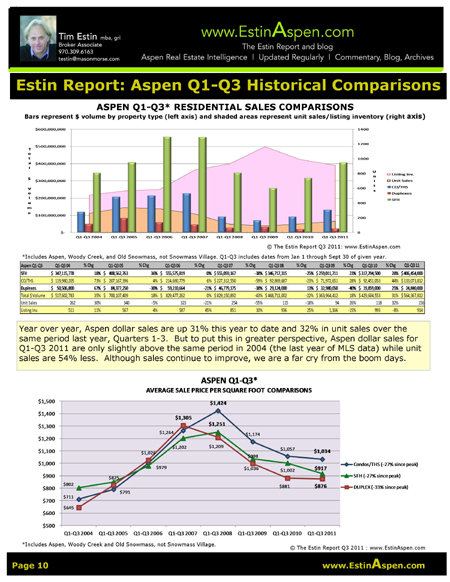
Total Aspen Snowmass Market In Q1-Q3 2011, the total Aspen Snowmass market rose +35% in unit sales (219 this year versus 162) and +28% in dollar volume ($695M vs $545M) ahead of Q1-Q3 2010.
But Quarter by Quarter comparisons this year indicate a slowing velocity of market expansion in 2011.
Q3 2011:
- $149M dollar sales (-29% from Q2 2011)
- 47 unit sales (-16% from Q2 2011)
Q2 2011:
- $206M dollar sales
- 53 unit sales
Q1 2011:
- $209M dollar sales
- 56 unit sales
3rd Quarter 2011 results indicate an abrupt slowdown and a loss of sales momentum from the 1st Half 2011. Whether this is temporary or more long lasting remains to be seen
Aspen Market
- Total Aspen dollar sales for all property types excluding fractionals are +31% this year and +32% in unit sales in Q1-Q3 2011 over last year Q1-Q3 2010.
- Aspen single family home sales are +28% in both dollar and unit sales for Q1-Q3 2011 over Q1-Q3 2010.
- Aspen condo sales have picked up considerably in Q1-Q3 2011, +44% in dollar sales and +38% in unit sales over Q1-Q3 2010.
- Median Aspen home prices continue to slide in Q1-Q3 2011, -14% from Q1-Q32010. In the Q3 2011, median Aspen single family home prices fell -24% in the quarter from a year ago Q3 2010. There were a number of over $10M sale in Median Aspen condo prices are +9% for the same period. Reason? There is more condo sales activity this year over last, and prices are not being discounted as much as they were a year ago. But make no mistake, considerable pricing pressure remains.
- Market strength in the under $4M category: in Q1-Q3 2011, 49% of Aspen single family home sales were below $4MM versus 38% in Q1-Q3 2010. This illustrates two points: 1) The fall in prices in the past 2 1/2 years - what used to cost $5M, now costs $3-4M; 2) Buyers are stepping up to take advantage of this pricing reset.
- In the ultra high end Aspen home market above $10M, unit sales increased +71% in Q1-Q3 2011 to 12 this year from 7 in Q1-Q3 2010, and +91% in dollar sales to $174.5M this year from $91.5M same period last year. The over $10M sold market represents 16% of the Aspen single family home market. In the first half of the year, there were (11) Aspen home sales over $10M that generated much national media attention. In Q3 2011, there has been only (1) Aspen home sale over $10M.
- Aspen single family homes dollar sales volume decreased -28%, to $104M in Q3 2011 from $145M in Q2 2010 while roughly the same number of Aspen single family homes (22) in Q3 2011 as were sold in Q2 2011 (24). This means either less expensive homes sold in Q3 2011 over Q2 2011 and/or that prices have continued to fall. It is likely a combination of both. The same sales pattern applies for Aspen condo sales, same number of units sold as last year, but dollar sales volume decreased.
- It takes twice the amount of time to sell an Aspen single family home from a year ago, to 457 days in Q3 2011 versus 227 days in Q3 2010.
- The average price of Aspen condos increased +36% although median prices remained nearly the same because +27% larger sized condos sold in Q3 2011 over Q3 2010, 1,647 sq. ft. versus 1,205 sq. ft. last year. What's happening? There were some notably large Aspen townhome sales (4,000-5,000 sq ft) in Q3 2011 which are combined with condo data in the MLS skewing the average numbers upward.
- The East Aspen /Independence Hwy 82 area saw a big surge in activity with 43% of total Aspen single family home dollar sales and 35% of total single family home unit sales during the 3rd Quarter. Whereas in the 1st half of 2011, the West End and Central Core accounted for 50% unit sales and 43% dollar volume.
Snowmass Village Market
- The Snowmass Village (SMV) market remains immensely challenging with continued uncertainty caused by the pending Nov. 16th Snowmass Base Village foreclosure sale. This sale has been re-scheduled 4 times in the past 18 months.
- The total Snowmass market was +43% in unit sales, from 43 to 63 properties, and +13% in dollar volume, from $116M to $131M, in Q1-Q3 2011 over Q1-Q3 2010. To put this in perspective, at the market peak, dollar volume was $287M and unit sales were at 111 in Q1-Q3 2007.
SMV single family home activity: Barely and painful.
- Single family home sales decreased -38% from 8 units sold in Q3 2010 to 5 sold in Q3 2011.
- n Q3 2011, it took +33% days longer to sell a single family SMV home, 362 days over 272 days in Q3 2010.
- Single family home median prices fell –16% during Q1-Q3 2011 over Q1-Q3 2010.
- Snowmass single family home average price per sq. ft. is off -60% for single family homes (refer to pg. 14) from the market peak.
High and low end single family SMV homes picked up while the mid-range priced product suffered in Q1-Q3 2011 over Q1-Q3 2010.
- In the upper end, homes above $10M, unit sales rose from 1 sale last year to 3 sales this year, +200%, and from $10M dollar volume in Q1-Q3 2010 to $45M in Q1-Q3 2011, +350%. These (3) sales were in 1st Half 2011. There were no over $10M SMV home sales in 3rd Quarter 2011.
- Remarkably, these (3) high end sales over $10M in Q1-Q3 2011 accounted for 49% of total SMV dollar volume.
- The low end under $2M climbed +200% to 6 units sold in Q1-Q3 2011 versus 2 units sold in Q1-Q3 2010. Some buyers are taking advantage of SMV deals.
- The middle $4M - 7.99M range, sf home sales fell -57% from 7 units Q1-Q3 2010 to 3 units in Q1-Q3 2011.
SMV Condos: bright spot - sales up but prices down.
- Condo unit sales are up +75% in Q1-Q3 2011 over Q1-Q3 2010, to 42 units this year (67% of market total) over 24 units last year, and up +49% in dollar volume, $38M this year (29% of total market dollars) vs. $26M last year.
- Condo dollar sales are +1% in Q1-Q3 2011 over Q1-Q3 2010.
- For the 3rd Quarter, condo sales improved to 10 sales in Q3 2011, +25%. from 8 sales in Q3 2010.
- Condo average price per sq. ft. is off -59% from the market peak. There are tremendous opportunities in SMV.
Market Overview
In general, market prices have reset to a post-crisis level, off on average 25 - 40%, and in some individual cases more, from the 2008 market peak. But much depends on the property, unique circumstances and seller motivation. Prices remain under pressure, at least incrementally, even assuming they have been re-adjusted to the “new norm”.
It remains unclear the extent to which we have in fact reached a bottoming of prices. The big question everyone asks is … are we still falling or are we scraping along a bottom?
As much of Aspen real estate activity is fed by our sense of well-being, there continue to be a number of reasons for uncertainty. Yes, we are a small mountain hamlet, but we all are connected now, and Aspen’s gold-leafed economic and social immunity has disappeared in the G5 age. If the stock market is up, it is likely that the local real estate market will mirror that and the converse applies as well.
As I wrote in my 1st Half 2011 report published July 14th and still relevant now, there continue to be reasons for concern:
- Continued High Inventory Levels: Even though the inventory of total active listings has fallen -20% from its 2009 high, it continues to remain at historically high levels. There still are many more properties for sale than buyers, and over supply, under demand translates into price pressure.
- Deal Savvy Buyers: While a sense of ‘missing the bottom’ is driving some buyers, others have adopted a ‘wait and see’ attitude. Unless motivated by a property they can’t live without at a price that demonstrates value, most prospective buyers will move on to the next property. Or continue to wait out the market. And even if these buyers get a property under contract, some continue to shop and deals are consistently falling out. Ask a title company – in uncertain times, many deals fall out.
- Lurking Shadow Inventory: There are a number of owners who’ve been pining to sell in the past three years who are waiting for improved market conditions. These properties will swell onto the marketplace as soon as there is a sense of relaxation of downward price pressure – but when there is this hint of relaxation, this ‘lurking’ pent-up inventory will appear on the market and pricing pressure will again resurface. Think of it literally as waves of inventory. Price 'relaxation' is unlikely to occur in my estimation for at least the next 6- 12 months if not longer until inventory levels subside. Those Aspen prognosticators who hype otherwise are misleading their public.
- Save Money and Build Option: The average and median prices of residential vacant lots have fallen -40% and -46% respectively from over a year ago (see Pg 7 Vacant Land). In many cases, it should be less expensive now to buy land and build with construction costs down 20-30% than to purchase an existing home. And the Pitkin County approval process is more expedient now than in the boom days with an estimated 18-24 months to build now versus 24-36 months during the boom. Lastly, as there is so little new construction taking place presently due to almost impossible financing conditions, by the time one completes the job in two years, there should be high demand for this new product priced at a premium as so little brand new supply will then be available.
- Uncertain US Economic Picture: Weakening employment and housing numbers confirm the fragility of this recovery.
- Global Economic Volatility: A Greek default, Euro-contagion, another Japanese earthquake type event – on top of the 2008 economic crisis - have created a general sense of fragility and lack of optimistic conviction. This is not doomsday thinking, it is the 21st Century world in which we now live.
So, the critical question: has the market turned?
Yes, in that real estate activity has significantly picked up and has returned to its more “normal” pre-2005-2008 pace.
No, because while the rate of price discounting appears to have stabilized, there continues to be extraordinary pressure on sellers to further reduce - even if incrementally - to get the deal done if one truly wants or needs to sell. If not, one is best advised to not list one’s property. It is a brutal experience for sellers.
To Sellers
If buyers perceive a listing is priced mark-to market (i.e. what would it take to sell today), or more commonly that “buyers perceive value”, properties stand a reasonable likelihood of selling within 3 -6 months. If not, sellers risk ‘riding the market ‘ down in these well-known stages: starting high thereby immediately disinteresting buyers and brokers, the listing then becomes stale, competitive properties sell, and finally the seller capitulates 1-3 years later in order to sell at the price he could have sold for in the beginning if only he’d listened. This scenario repeats itself time and again with sellers stubbornly holding on to their lost hopes.
Unfortunately, other factors such as the time value of money – it costs money to service a property,the opportunity cost to forgo other better opportunities while a property - and the cash it ties up - sits on the market, and the importance of “getting on with it” as life moves on, are not preeminent pricing considerations by the seller when a property is initially listed. They should be.
Sellers should be realistic and match up their motivations with their pricing.
To Buyers
Find the property one loves, that one believes one may be able to afford, and make a bid at a level one is comfortable with. Making a written offer is the only way to get real information back from the seller. See what happens. Negotiations have to start somewhere, and many properties are selling at levels even brokers have a difficult time believing. One never knows the real story…especially in this market.
What is Selling?
The strongest selling geographic areas in Q3 2011 are: East Aspen/Independence area, Aspen Core, the West End, Snowmass slope side ski-in/out.
The most successful property types selling in Q3 2011 are: new construction homes and remodeled – like new - condos, large uniquely built homes whose size, quality and location are not easily reproduced, properties priced “to market” and highly discounted vacant lots in B+ or above locations.
Disclaimer: The statements made in The Estin Report and on Tim Estin's blog represent the opinions of the author not Mason Morse Real Estate. They should not be relied upon exclusively to make real estate decisions. A potential buyer and/or seller is advised to make an independent investigation of the market and of each property before deciding to purchase or to sell. To the extent the statements made herein report facts or conclusions taken from other sources, the information is believed by the author to be reliable, however, the author makes no guarantee concerning the accuracy of the facts and conclusions reported herein. Information concerning particular real estate opportunities can be requested from Tim Estin at 970.920.7387 or by email. The Estin Report is copyrighted 2011 and all rights reserved. Use is permitted subject to the following attribution: "The Estin Report: State of the Aspen Real Estate Market, By Tim Estin, mba, gri."